Interview Question: P&L Chart
Welcome to the Dkoda: Frontend Engineer interview question. Please read the instructions carefully and upload your solution here.
1. Introduction
In this exercise, you will build a P&L (Profit & Loss) chart. A P&L chart is a graph that displays potential gain or loss from an options contract depending on the spot price of the underlying asset. It helps you visualize an option strategy’s theoretical profits or losses at expiration. This is a great way to gain some insight into any particular options strategy before you enter into a position.
An Options contract is a right to buy or sell an asset in the future for an agreed upon Strike price.
Click here to learn about Options.
Click here to learn about Options.
2. Goal
For this exercise, you will build a full page which contains a P&L chart. The page is expected to load data from a JSON API and then render the chart. You should think about different cases such as when the data is loading and something goes wrong while fetching then add appropriate content and messaging to inform the users.
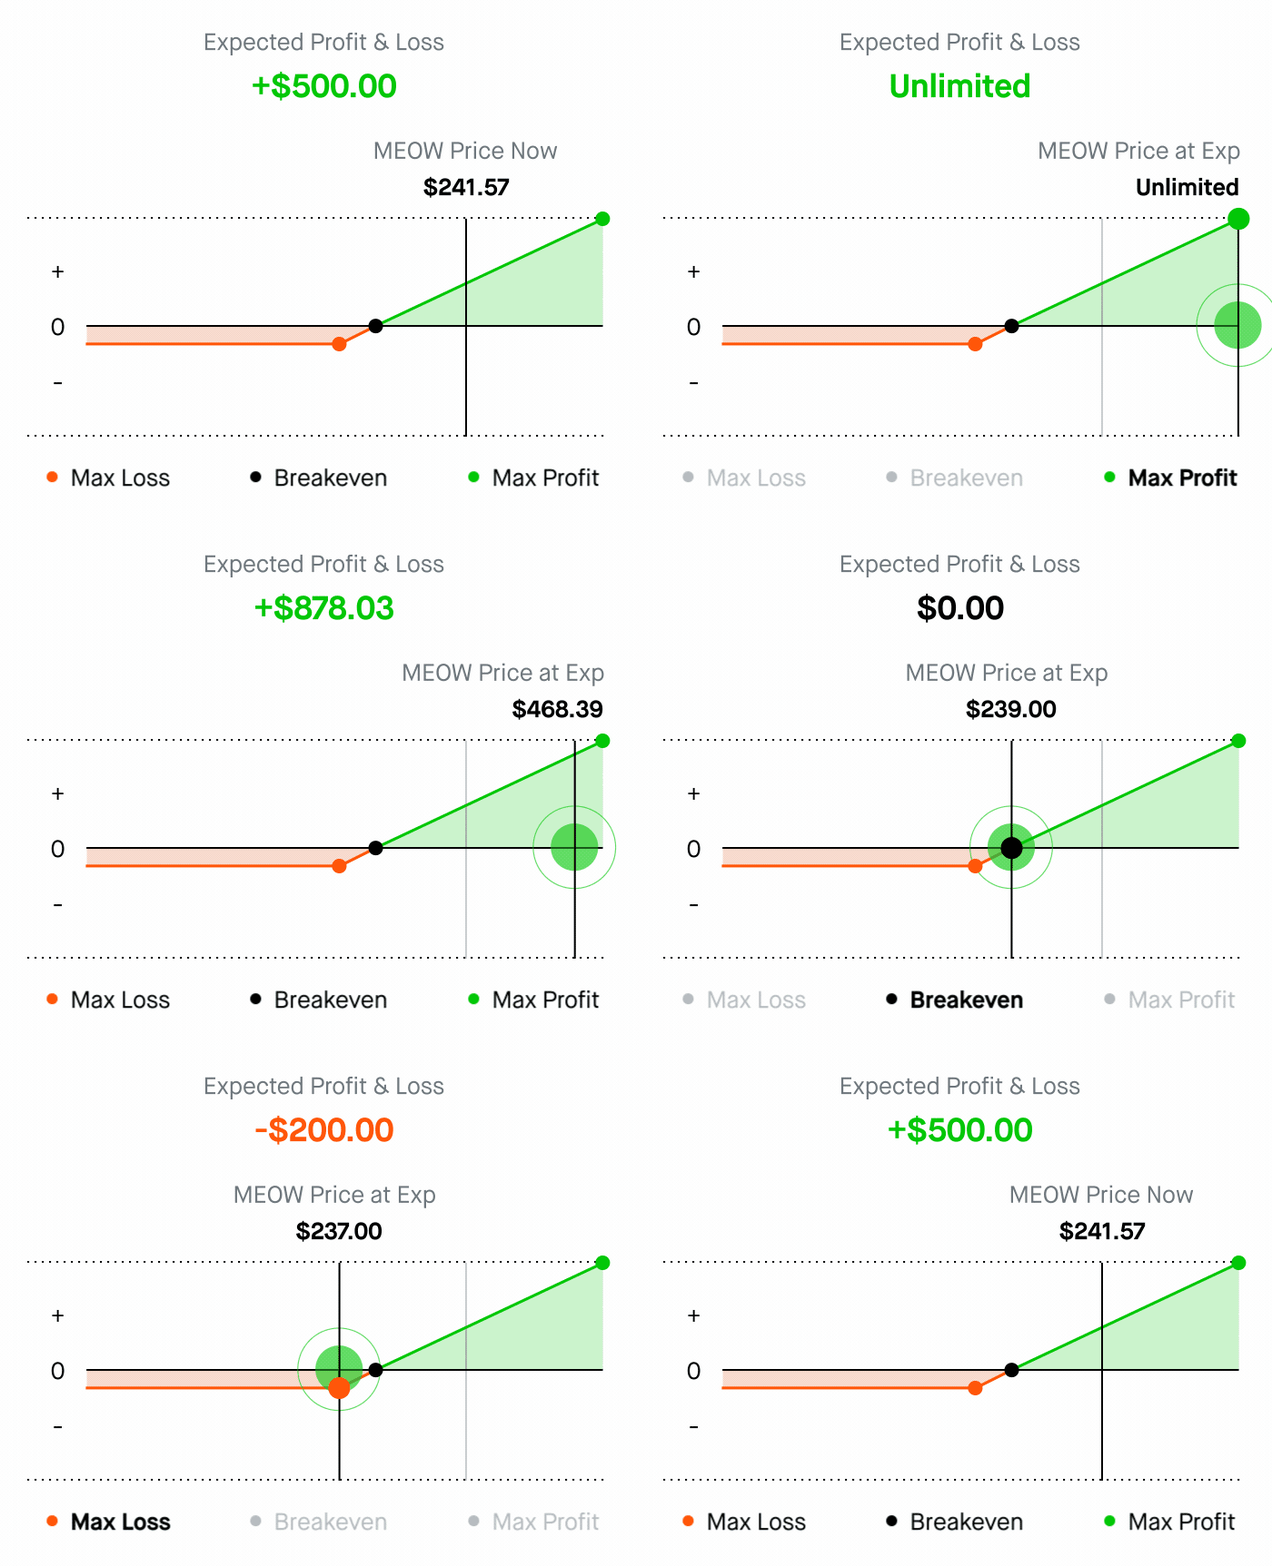
Here is an example of what you will be building...

3. Deliverables
Download the empty starter project here. You will create a new component to render the P&L chart and call it in the base App.tsx file.
- The page & component needs to be written in React.
- Utilization of React hooks is encouraged.
- Please include styling and make the page pretty. Usage of Tailwind CSS is preferred.
You are allowed to use any external library to build out your page and it's encouraged. They should be npm packages. However, you will need to build the P&L graph yourself. You can utilize a chart library such as Recharts.
You will need to make a GET request to https://mqcmmn3bpx.us-east-1.awsapprunner.com/pnldata to fetch the option data. Utilize the properties of the returned response to construct your P&L graph. Be careful that this endpoint will sometimes throw errors!
4. Example & Details
For the following graph, we are using a CALL option which was sold for 0.8 ETH (Ethereum) and the agreed upon strike price is 16 ETH. This means that the person who bought this Option contract can purchase the collateralized asset for 16 ETH before the expiration date.
Someone can make a profit from exercising this contract when the floor (spot) price of the underlying asset goes over 16 ETH + 0.8 ETH (Strike price + premium). If the price of the underlying asset goes over 16.8 ETH, the person is making a profit.
If the price of the asset stays under 16.8 ETH, the person will be losing money. If the price is still above 16 ETH, then the person can still exercise this option and make back some of his money If the price of the asset is 16 ETH or below, the person cannot exercise the option because he will lose money, so he will just let the option expire (become worthless). When this happens, the only money the person will have lost is the 0.8 ETH he used to buy the contract.
The following is our implementation which displays the P&L data for this option:
- Strike Price: 16.0 ETH
- Option Price: 0.8 ETH
- Current Floor Price of the Asset: 15.8 ETH
Current Floor
15.80
Floor on Exercise
15.80
Expected Profit / Loss
-0.80
5. Submission
Create a new repository and upload the result into your Github account. Make sure to make the repository public. Then submit your information along with a link to the Github repository by filling out this form.